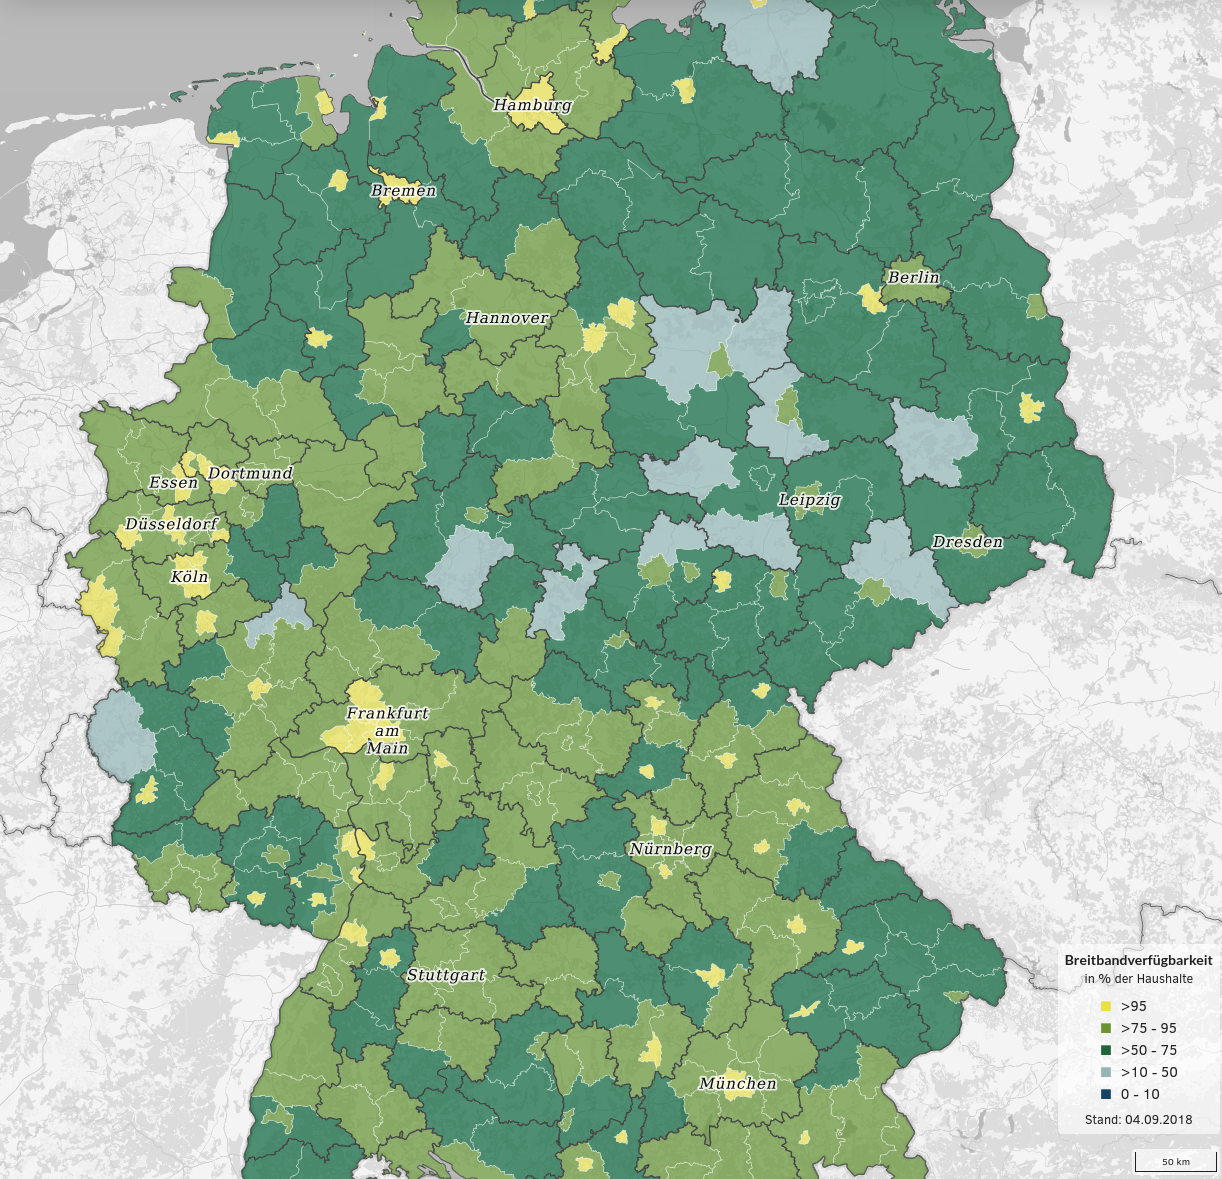
Private broadband availability from 50 Mbit/s: Urban areas mostly range between 75 and 100% with light green and yellow - More rural areas are generally less well connected. (Source: https://www.bmvi.de/DE/Themen/Digitales/Breitbandausbau/Breitbandatlas-Karte/start.html)

Performance Optimization in AEM (Part 2): User groups and key figures
In part 1 of the series on performance optimization in enterprise web projects, the causes of performance problems in enterprise projects were discussed. This part will cover the KPIs that are used to measure the performance of websites, as well as some tools that can be used to collect and track these numbers. In the following parts, concrete tools and measures will be presented, how the performance of a website can be measured, improved and the progress can be persisted.
Don't trust statistics...
...hackneyed saying. But it is quoted again and again, because it expresses that correct numbers are used again and again to present incorrect assumptions as obvious facts. Numbers cannot be shaken and we need them, because: "You can't manage what you can't measure"; But already Sherlock Holmes found "Nothing is more deceptive than an obvious fact"...
So that we can question these obvious facts and understand them in all their deceitfulness, it is always worth taking a look at the details. Especially with a cross-cutting issue like performance, the right numbers for the same website can prove that "everything is OK" - or that the next infrastructure, architecture or beauty package is urgently due to straighten out the drastically messed up numbers.
So, let's try to clarify: What should we look at? What do we need to look at? And with which tools?
Step 1: Analysis
Whether you want to improve performance because it has been problematized "from the outside" or because you simply consider it necessary and sensible "from the inside" plays a secondary role. It is important to first check which use case one finds and wants to improve. If the problem comes "from outside", you have a small advantage: The problem comes from the real world - not from the corporate bubble. So you can already roughly determine where the shoe pinches.
The first impression...
This is also the latest time to start tracking user interaction with the site. We need to find out - in order from important to unimportant:
- Which pages do our users get on?
- What devices are users using to visit our site?
- With which bandwidth are our users visiting our site?
- How long do users stay on which pages?
The most important thing first: the entrance to our platform. This is where we decide what to focus most of our measurement and optimization efforts on. This does not always have to be the homepage: if, for example, we advertise one of our products massively and have the main part of the entries via a page that is linked to an advertising campaign, the main focus should also be on optimizing this campaign page and not, for example, the homepage. But not only that: an essential factor of performance optimization is caching: if we call up the first page, we have nothing in the cache. Everything that comes after that, if it has already been downloaded, is served from the local memory and is therefore incomparably faster. Therefore, we have to pay special attention to which critical parts of the website we already deliver here and that they are reusable as much as possible.
The question about the entry point is closely followed by the question about the devices that users use. If we run an online document portal, our traffic is probably still mainly generated by desktop PCs, while news sites now generate well over half of their traffic via mobile devices (sources: t3n, statista). The devices that users use to access our content have a massive impact on the factors we need to consider in measurement and optimization: Screen size and format, CPU and GPU performance, browser, and so on.
There's no network on the mountain pasture
In connection with the mobile vs. desktop devices factor, there is also the bandwidth factor. This factor depends on the target group in several respects. If, for example, we have a large proportion of young users who access our content, this will probably be done mostly with mobile devices via mobile networks. 3G and 4G are then the benchmarks we should use for measurement. If we run a platform in B2B, our users will probably mostly use desktop PCs with 100MBit broadband connections. But the connection with the devices is not the only one to be discerned. In fact, despite all the painful clichés, the regional factor should also be included. If we run a regional news site for Saxony-Anhalt or the Upper Palatinate, we will probably have different challenges and priorities than when we provide a website for a young, urban capital city magazine or a municipal energy supplier. (Source: bmvi)
Last but not least, the so-called user journey should also be taken into account. The usual goal of an application in the field of online marketing is conversion. The path from entry to the page to conversion rarely takes one or two steps: usually products have to be selected, data entered, forms submitted, or even a purchase made. If we take the example of the online store: Here we have created a fabulously fast entry to the page through numerous optimization measures, but this does us no good if the users bounce when they call up the product pages, because after 40 seconds it still does not display the image of the desired product. Numerous tools allow us to capture the entire user journey and look at it in detail to eliminate such problems.
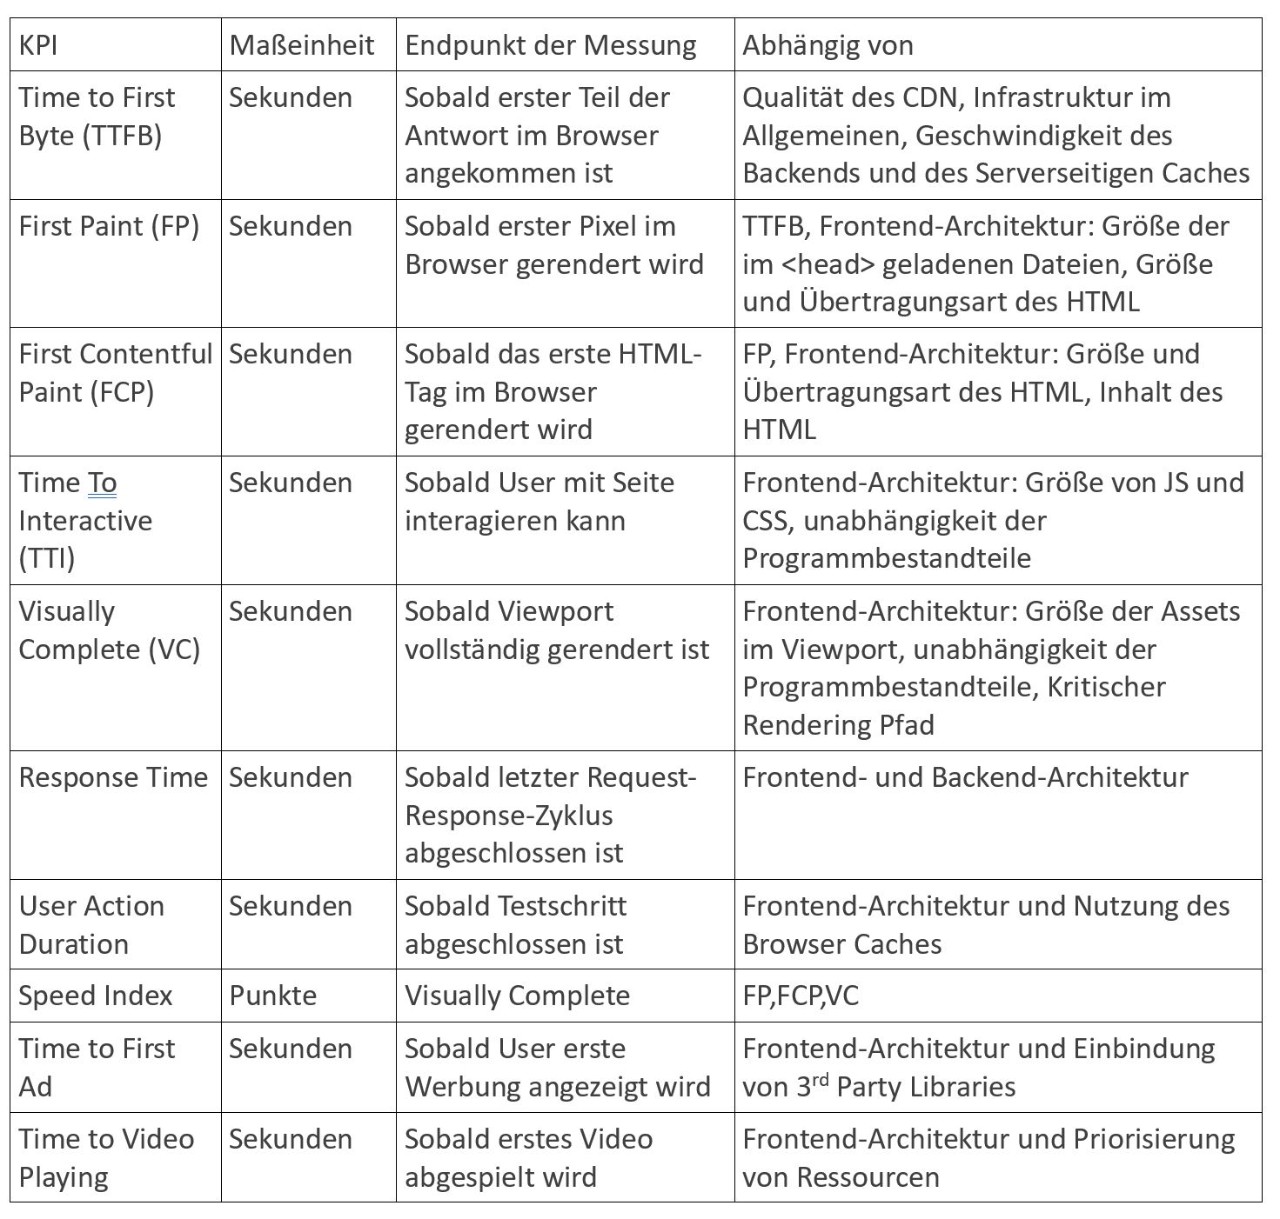
Step 2: KPIs
Now that we know what factors to look at, and now that we can throw around dashing words like "entry points" and "user journey," it would be quite fitting if we could adorn these components of our measurements with numbers to sustainably improve - and measure deterioration of - these aforementioned factors. In the following, we will present some key performance indicators (KPIs) that should prove useful for the respective measurements. However, not every KPI can be discussed here - that would go beyond the scope and would probably be outdated again in just a few months.
On your marks...
So when we look at our users entering the site, what flows happen? How can we divide these flows? And which parts of the flow have what meaning?
Time to first byte / Time to last byte
First, let's consider a simple case: we are the operators of the online store amazing, whose name is known, so its home page is the main entry point. So let's consider the process of a user entering the URL "amazing.com" of the store into the browser line and confirming it to get to the page. This is where our measurement starts.
The user's request travels via cable, fiber, air, or pneumatic tube from the user's computer to the server. The server processes the request and prepares to send the response back. As soon as the first letter of the response is returned to the user, we have a first measure: the time to first byte or, to be more precise, the time to first byte of response. Mind you, the browser hasn't even started processing the response yet. We are still before the first visible change. Time to first byte = time that elapses between the first request and the first byte received.
Our store is secure, so the first request to "amazing.com" is redirected to "https://amazing.com". In addition, our store is international, so the user who accesses the store from Germany is then redirected to the German-language page "amazing.de". From "amazing.de" there is another redirect to the index in German language: "https://amazing.de/de/index.html". Even though the user doesn't notice this, except that the URL in the browser line changes several times, we have already received several responses from the server. Now, finally, an HTML document is requested. For the first time the browser receives content it can do something with. Here it gets a bit complicated again with the nomenclature. Because of course it is very worthwhile to measure the time to first byte for this HTML. So it is worth to use the same measurement values for the different parts of the request. The time to first byte of the initial HTML divides the measurement into two parts: on the one hand, there is the backend architecture and infrastructure, and what comes after that is mainly due to the frontend architecture. Therefore, the time to first byte of the initial HTML is often simply referred to as backend time.
In addition, we can measure when the HTML document download is complete: the time to last byte of the initial HTML document. Once the initial HTML document is downloaded, the browser can theoretically start rendering the document.
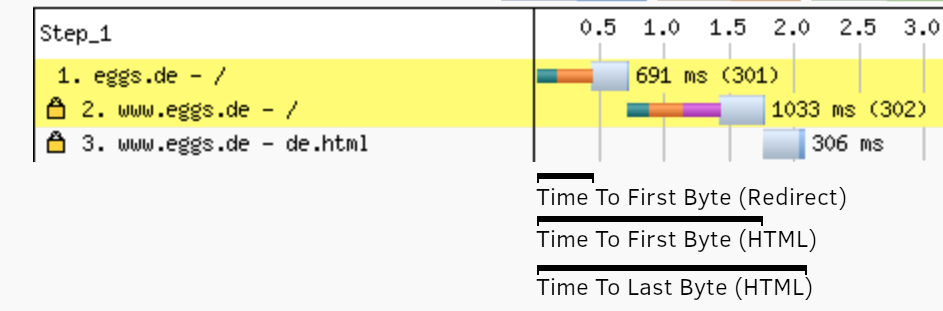
Time to First Byte: Two redirects (301 and 302) and their timings, allow statements about the infrastructure; the TTFB and TTLB of the HTML are the result of these timings and the size of the HTML.
Paint KPIs
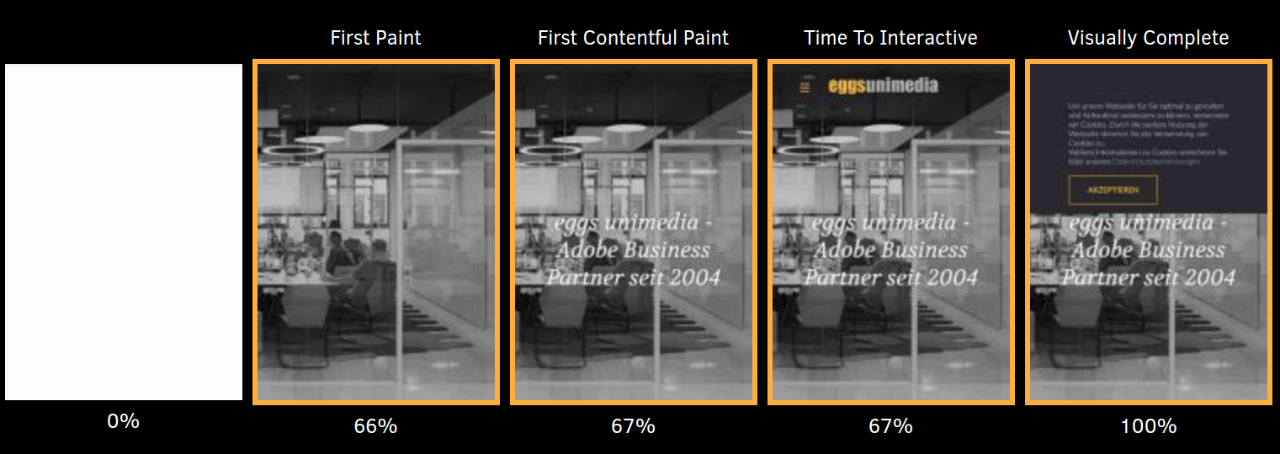
Let's assume that our store has a very special color in the CI, let's say a dark orange, and this dark orange is the background color of our store. This basic information is contained in the styles that are stored in the HTML document. When the user opens the page, the background of the page in the browser will change first. As soon as, usually only for a fraction of a second, the first changes occur in the window, one has reached the next important measurable variable: the First Paint. From personal experience, this moment may be the first one that sounds familiar: You navigate to a page and you get the reassuring feedback that something is happening. As such, the First Paint is already relevant to the user experience on our online store.
With the background alone, however, the user can still do nothing: Next, for example, the controls of the navigation should load. If real content is displayed on the page for the first time, regardless of whether these are input fields, images, or the navigation links, this is referred to as the First Contentful Paint.
However, this content is often a fallacy. We know it from smartphone use in the subway, for example, or from the mobile network that people use to connect their laptops to the Internet when they're sitting on the train: The page builds up, but nothing can be clicked or entered yet - our store doesn't react yet. Only when the user is able to interact with the elements, we talk about the time to interactive.
In many cases, this moment is the same as the moment when nothing changes in the viewport, also called "above the fold", i.e. the content visible in the browser window. The time that passes until nothing changes in the initial content visible to the user is called Visually Complete.
Response Time
Often, however, additional content is loaded in the background: Scripts for further use or images that are outside the viewport are preloaded, or tracking scripts are executed that download further scripts but have no visible effect for the user. This often manifests itself by an even further spinning "loading icon" in the browser, although we are already interacting with the page. The time until these further request-response cycles are completed is often referred to as response time.
Based on the described process, it is clear that individual points during the loading and construction of the page can be measured very well. The questions "When do our users start to see something?" or "When is the page fully functional?" can thus be answered very well.
However, the above-mentioned measurement values are only suitable to a limited extent for recording and measuring an entire "user journey". For this purpose, the company Dynatrace has created the measurement value of the User Action Duration. This measurement value records not only the connection, loading and rendering times, but also the interaction times, and thus extends the validity of measurements that are supposed to represent real interactions with the page. More information about the User Action Duration can be found directly at Dynatrace.
Speed Index
Another noteworthy measurement is the Speed Index, which summarizes the timings described above from Time to first byte to First Paint to Visually Complete in a point score. The Speed Index is calculated using an inverse derivative function over the visible render progress of the page.
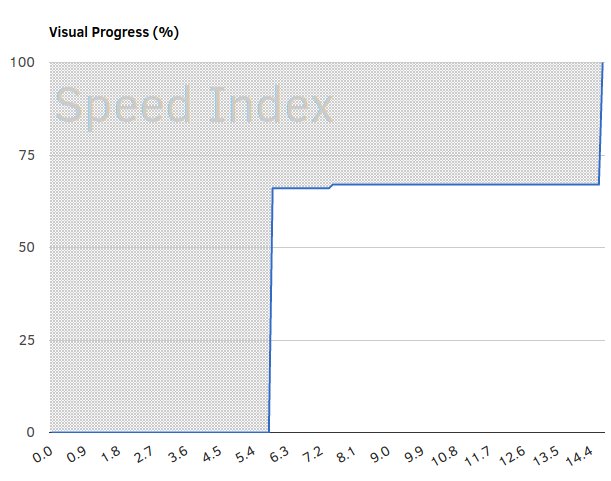
Speed Index: The blue line represents the render progress in percent during the page build. The area above the graph is used to calculate the Speed Index: the smaller the area, the better. In this way, for example, differences can also be determined for render runs that have the same First Paint and the same Visually Complete.
Further KPIs
This already sounds relatively complicated and confusing - but of course it should not be everything. The metrics that are recorded depend heavily on the purpose of our site.
For example, if our online presence, unlike an online store, generates its revenue or part of it through advertising placed on the website, it is very relevant when users first see such advertising. Accordingly, here it would make sense to measure the Time To First Ad.
Let's assume that we are dealing with a company that does not have its own B2C sales structure, but has a large marketing budget for video campaigns that are used for brand management. And let's assume that the production of promotional videos is relevant part of brand maintenance and our website is mainly used to distribute the promotional videos. For this case, for example, it may also be worth measuring a Time To Video Playing.
As you can see from the last two examples, the measured KPIs are highly dependent on the use case. There are KPIs that apply generally, the measured values influence each other, and they have different relevance in different cases. The correlation of these KPIs with the observed devices and speeds is also explained all the more here - and it becomes all the more clear that all these cases should be considered and prioritized individually. In addition, performance problems can occur not only when the website loads, but also during interaction. As far as front-end performance optimization is concerned, naked numbers alone cannot always provide the solution: the essentials are visible to the eyes.
The next part of the series will look at the tools that can be used to measure the performance of a website and identify initial problems to provide a basis for discussing possible solutions.
Many of the measurements and measurement techniques mentioned here, as well as the consideration of the users, are part of detailed discussions and will be continuously improved and sharpened. Comments with suggestions for improvement, additions or other feedback are very welcome!
Author

Contact us
Contact

Martin Brösamle
Head of Sales and Marketing
Balanstr. 73, House 19 81541 Munich
E-Mail: info@eggs.de Headquarter: +49 (89) 743456-0